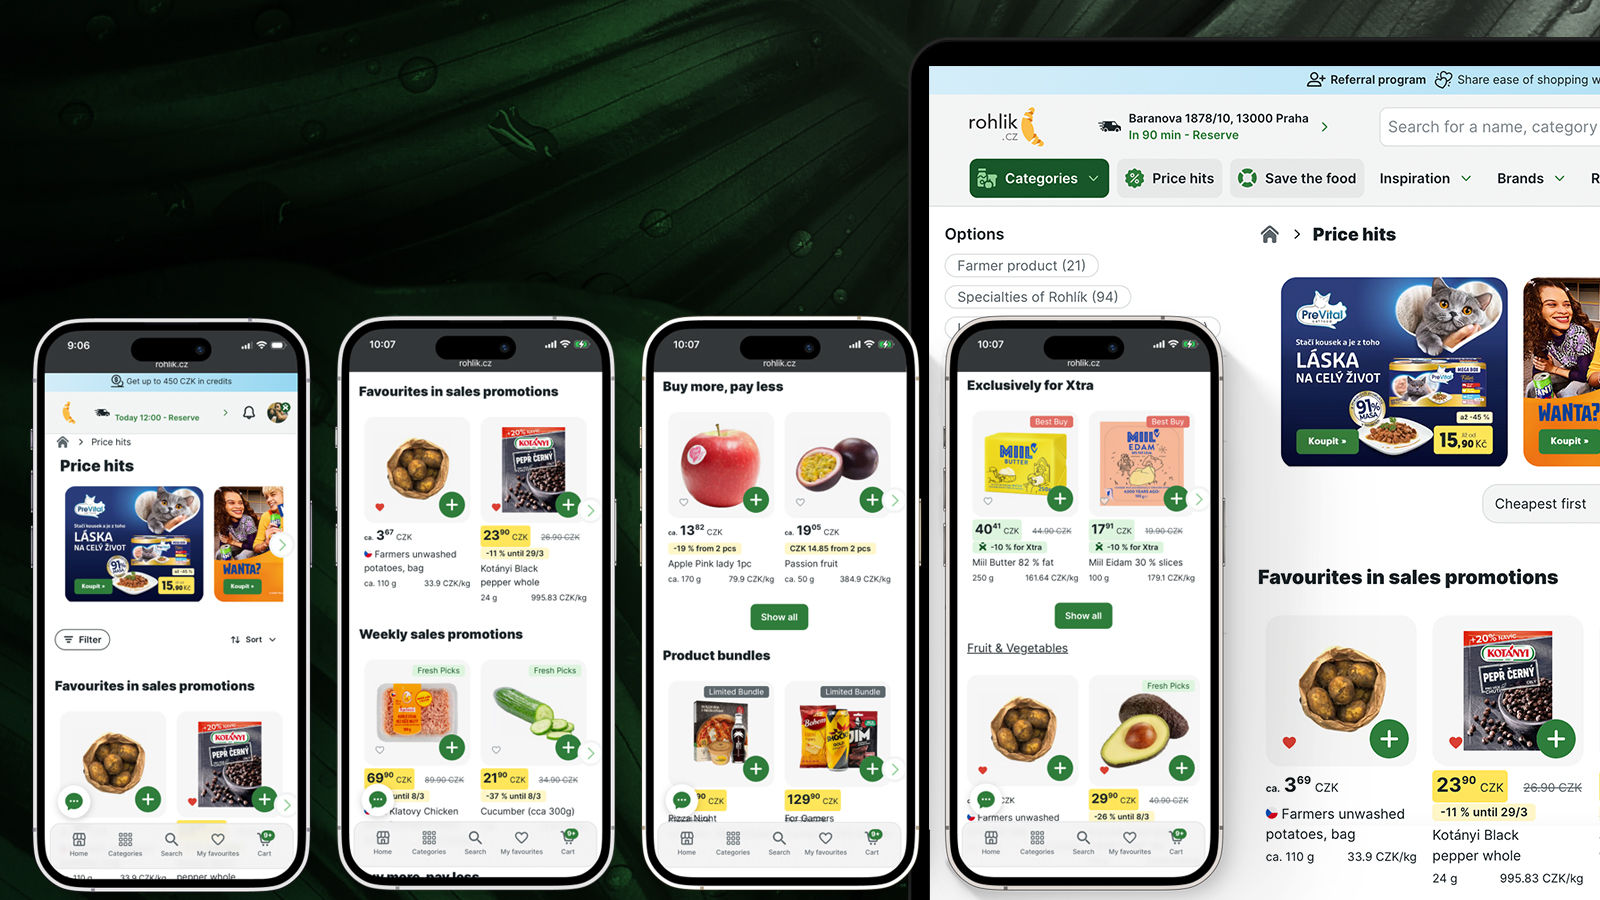
Discounts Hub (All Discounts in One Page)
This: 29 Oct 2025–26 Jan 2026 | Previous: 31 Jul 2025–28 Oct 2025TL;DR
Built a single destination for all promotions that turned scattered discount discovery into a structured browsing experience - driving +14.86% revenue and +11.36% order growth vs the prior 90-day period.
Problem
Customers had to hunt for promotions scattered across the site, causing fragmented discovery and missed conversion of value-seeking shoppers. Baseline data showed buyer penetration declining (-1.44pp) and basket penetration softening (-0.64pp) - signalling that growth was concentrating in existing buyers rather than attracting new ones.
Solution
Results
Key Learnings
- —Penetration is the north star KPI. Revenue and orders can mask softening penetration.
- —Orders up + basket penetration up + AOV up = incremental value. When all three move together it signals new demand, not just shifted existing spend.
- —Guard against deal-only baskets. Pair discounts with bundles, (buy more, pay less / product bundles) and cross-sell at appropriate touchpoints.
Average Order Value — total revenue divided by number of orders. A rising AOV alongside order growth signals customers are spending more per visit, not just visiting more.
Buyer penetration — the percentage of the total addressable customer base that made at least one purchase in a given period. Declining penetration means fewer unique buyers, even if revenue holds.
Basket penetration — the percentage of orders that include a specific category or product. Softening basket penetration means fewer baskets contain the item, often a sign of reduced discovery.
pp (percentage points) — the arithmetic difference between two percentages. A move from 10% to 9% is -1pp, not -10%.